Article
Newsletter: October 2026
Curbcut Studio is live: hundreds of ready-to-use indicators, an analysis assistant and shareable dashboards for planning teams. Plus team news and SIIViM 2026.
Dominique Boulet · October 13, 2026

Spotlight
The big news
- Curbcut Studio, our new workspace for projects that need spatial insight, is live! It brings together the data behind Curbcut’s city platforms, tools to analyze it, and ways to share what you find.
- On most spatial analysis projects, teams can spend the first weeks finding and cleaning data, and then wait for a GIS specialist before they can start the analysis. Curbcut Studio skips that step:
- It has hundreds of built-in indicators, ready from day one. They’re cleaned and built on the same geographic framework, so you can cross any two, and bring your own data into the mix.
- There is an assistant to help you with the analysis. You can ask the assistant a question you would ask a colleague, and it’ll run it against the full database.
- There is one shared workspace, from analysis to presentation. Your team can work from the same data, and your findings can be put straight into a report.
- On most spatial analysis projects, teams can spend the first weeks finding and cleaning data, and then wait for a GIS specialist before they can start the analysis. Curbcut Studio skips that step:
- It’s built for planning teams in government, planning firms and non-profits, and researchers, with no technical expertise needed.
- Book a demo here!
- Used curbcut.montreal or curbcut.toronto? Those addresses now take you to Curbcut Studio, and all the data is still there. See what you can do with it in our interactive live projects in Montreal or Toronto.
New features
The team is constantly improving the Curbcut experience
- What you can do in Curbcut Studio:
- Dashboards
- Put maps and charts from different indicator pages together on one grid, then publish it as a link you can share. When you update an indicator, your dashboard updates too.
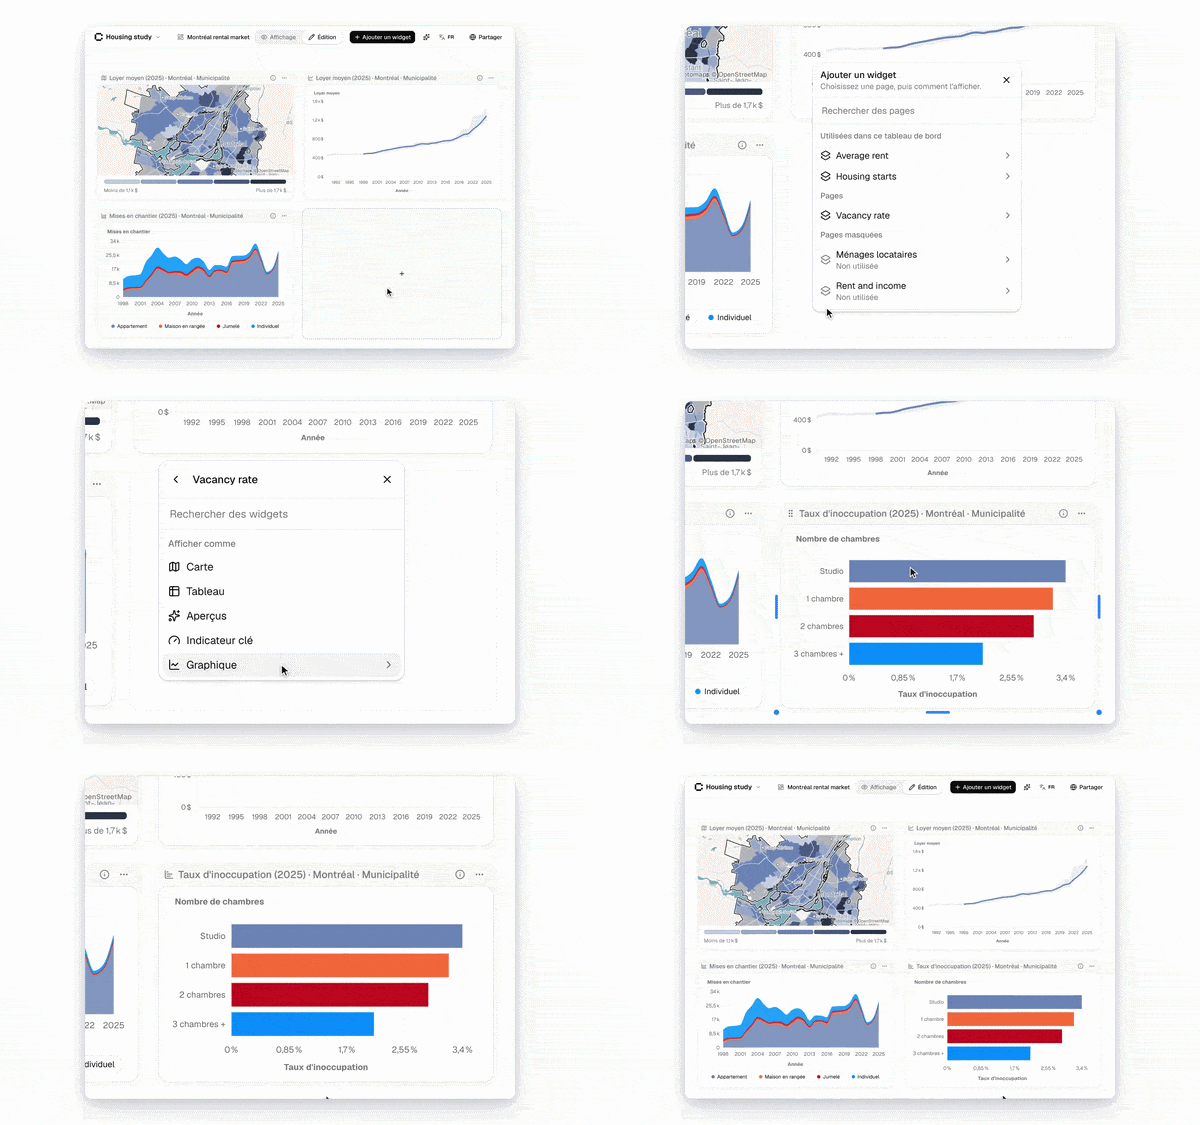
- Build indicator pages your way
- Choose and reorder the widgets on each page, and switch any of them to a map, chart, table, or key insights.
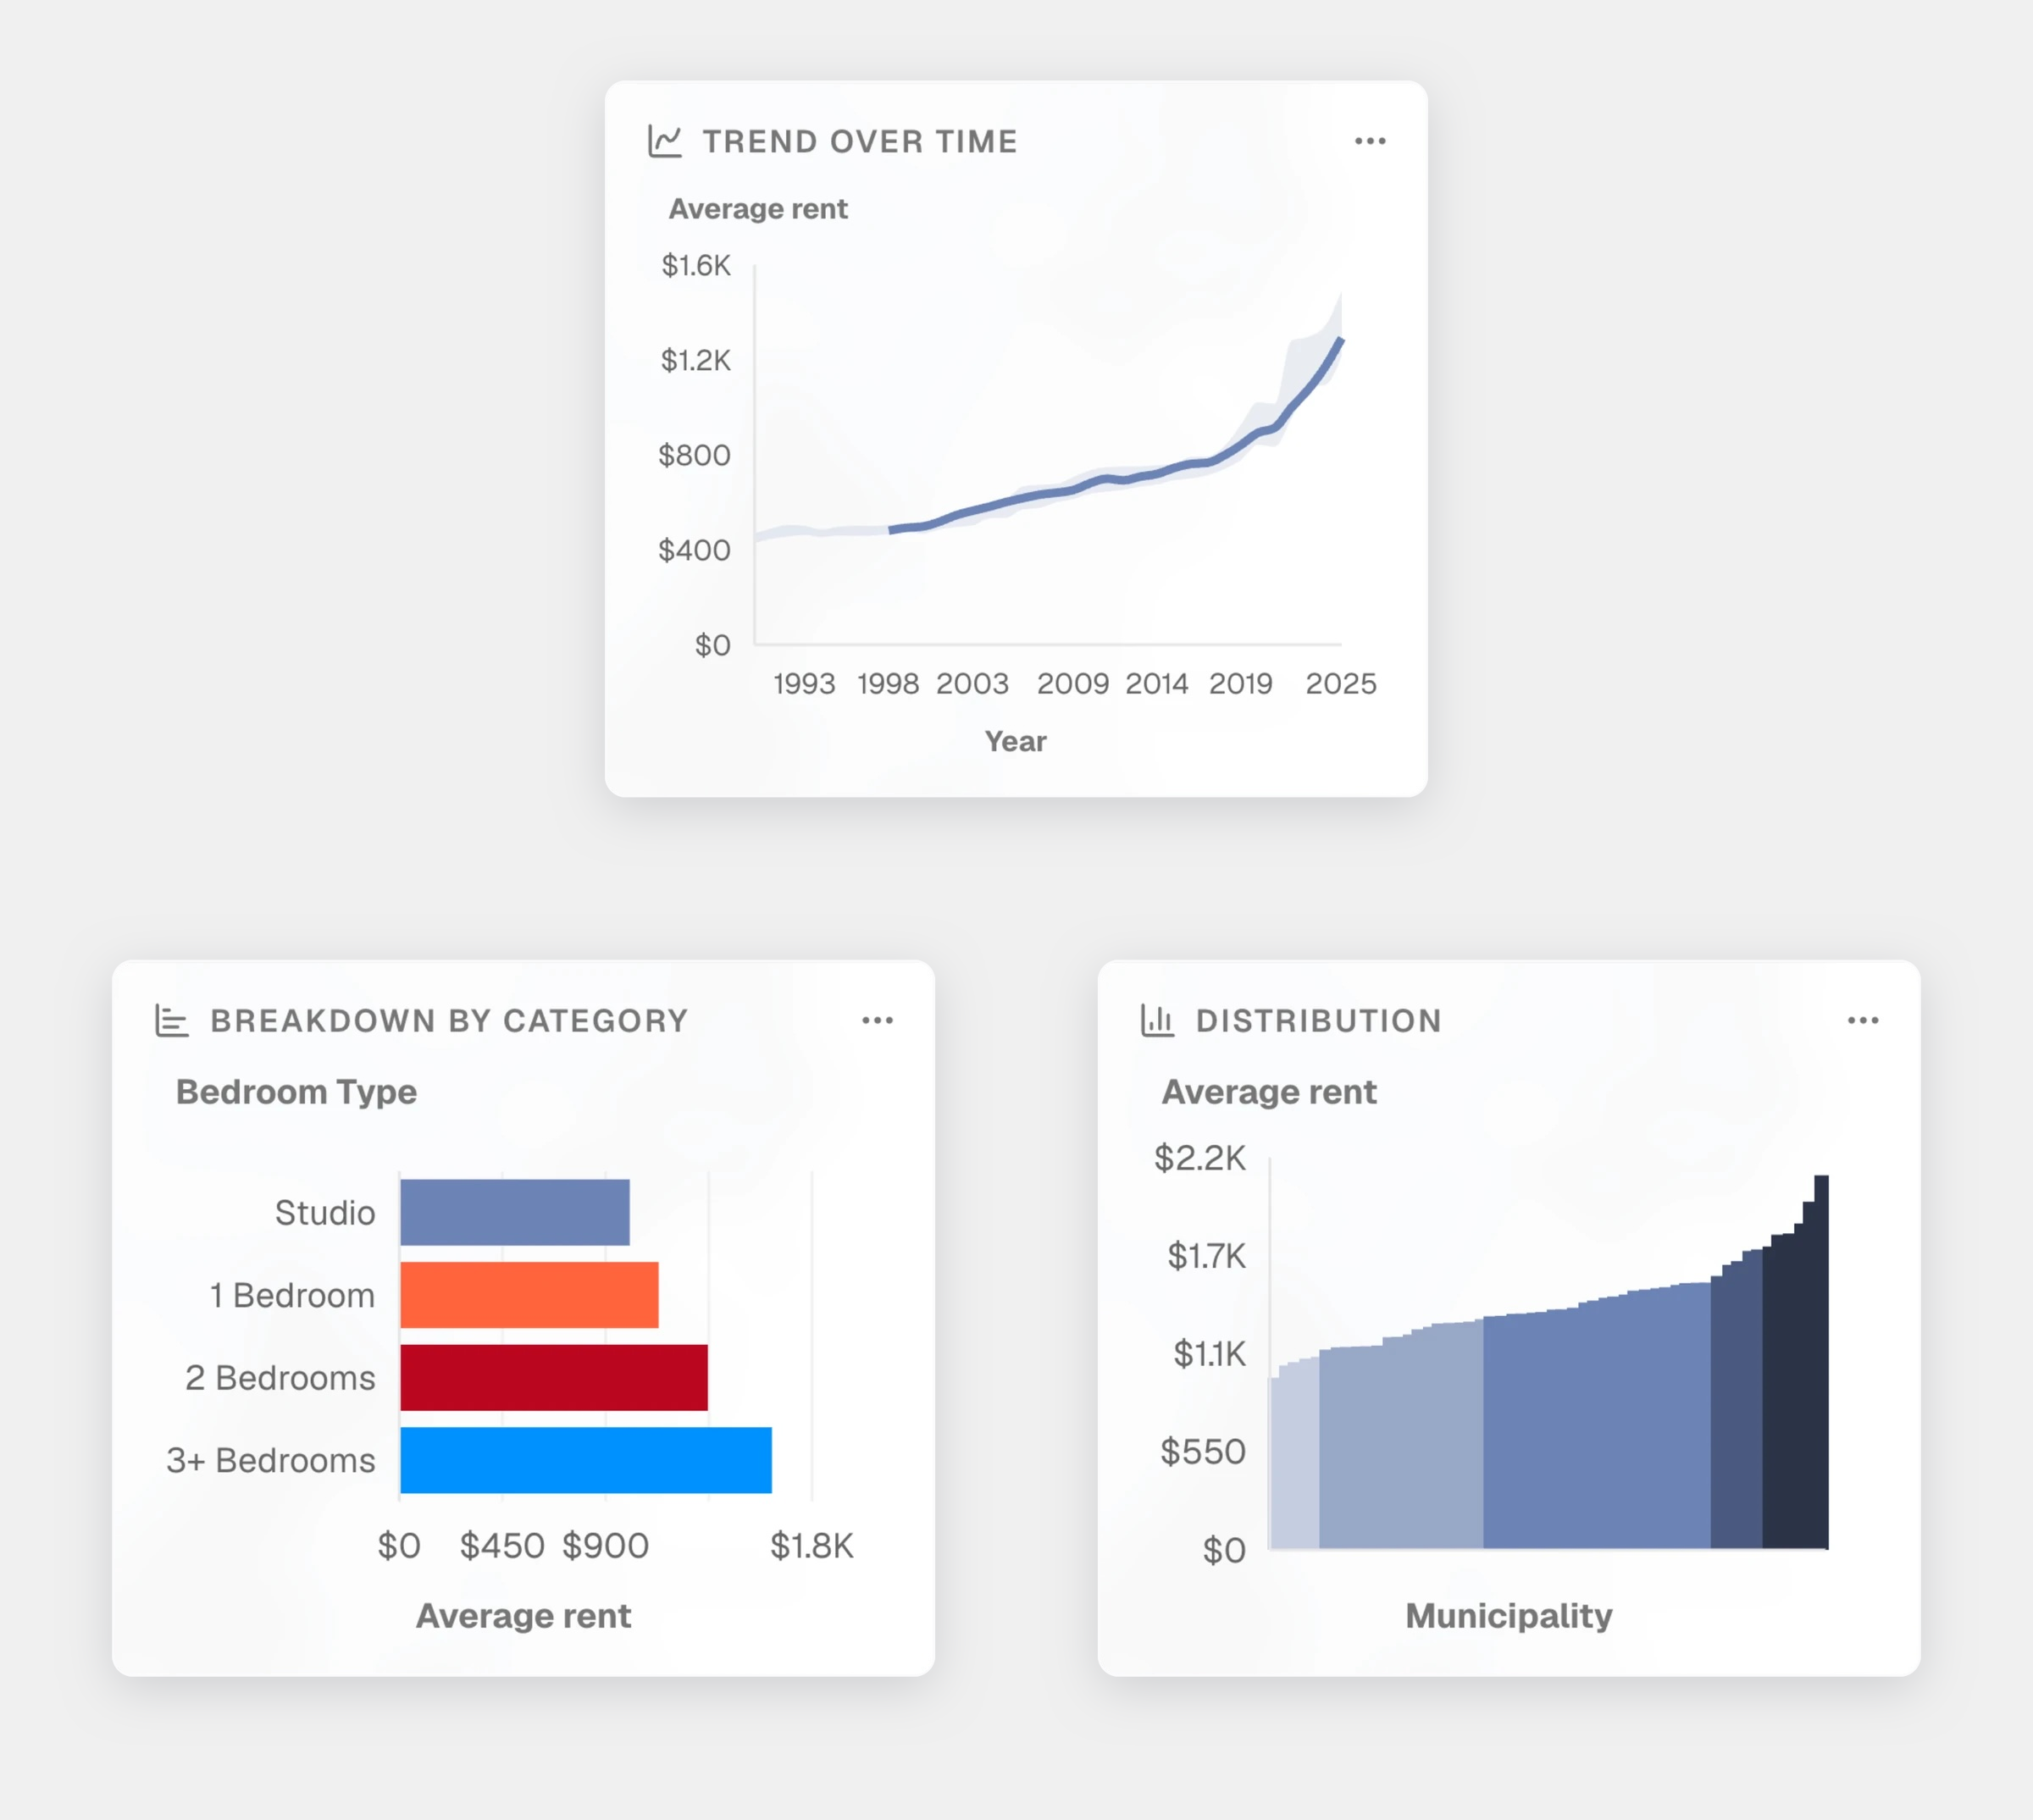
- More charts alongside your maps
- The map side panel now shows several chart types, not just a single distribution. You can get more context on each indicator at a glance.
- A clearer way to compare two indicators
    - When you cross two indicators, the legend is not a three-by-three grid with labelled axes, and it stay readable when exported or printed.
- These join everything you can already do in Curbcut Studio: work in shared projects, bring in your own data, embed charts and tables in your reports, and publish with your organization’s colours and logo.
- See every update at studio.curbcut.ca/changelog
Organizational updates
What's going on in and around Curbcut
- Welcome to Zara Farhan, who joined us this fall as our Quality Assurance intern! She is putting our tools through their paces, testing maps, charts, and exports across browsers, languages, and devices, so you don’t run into any problems.
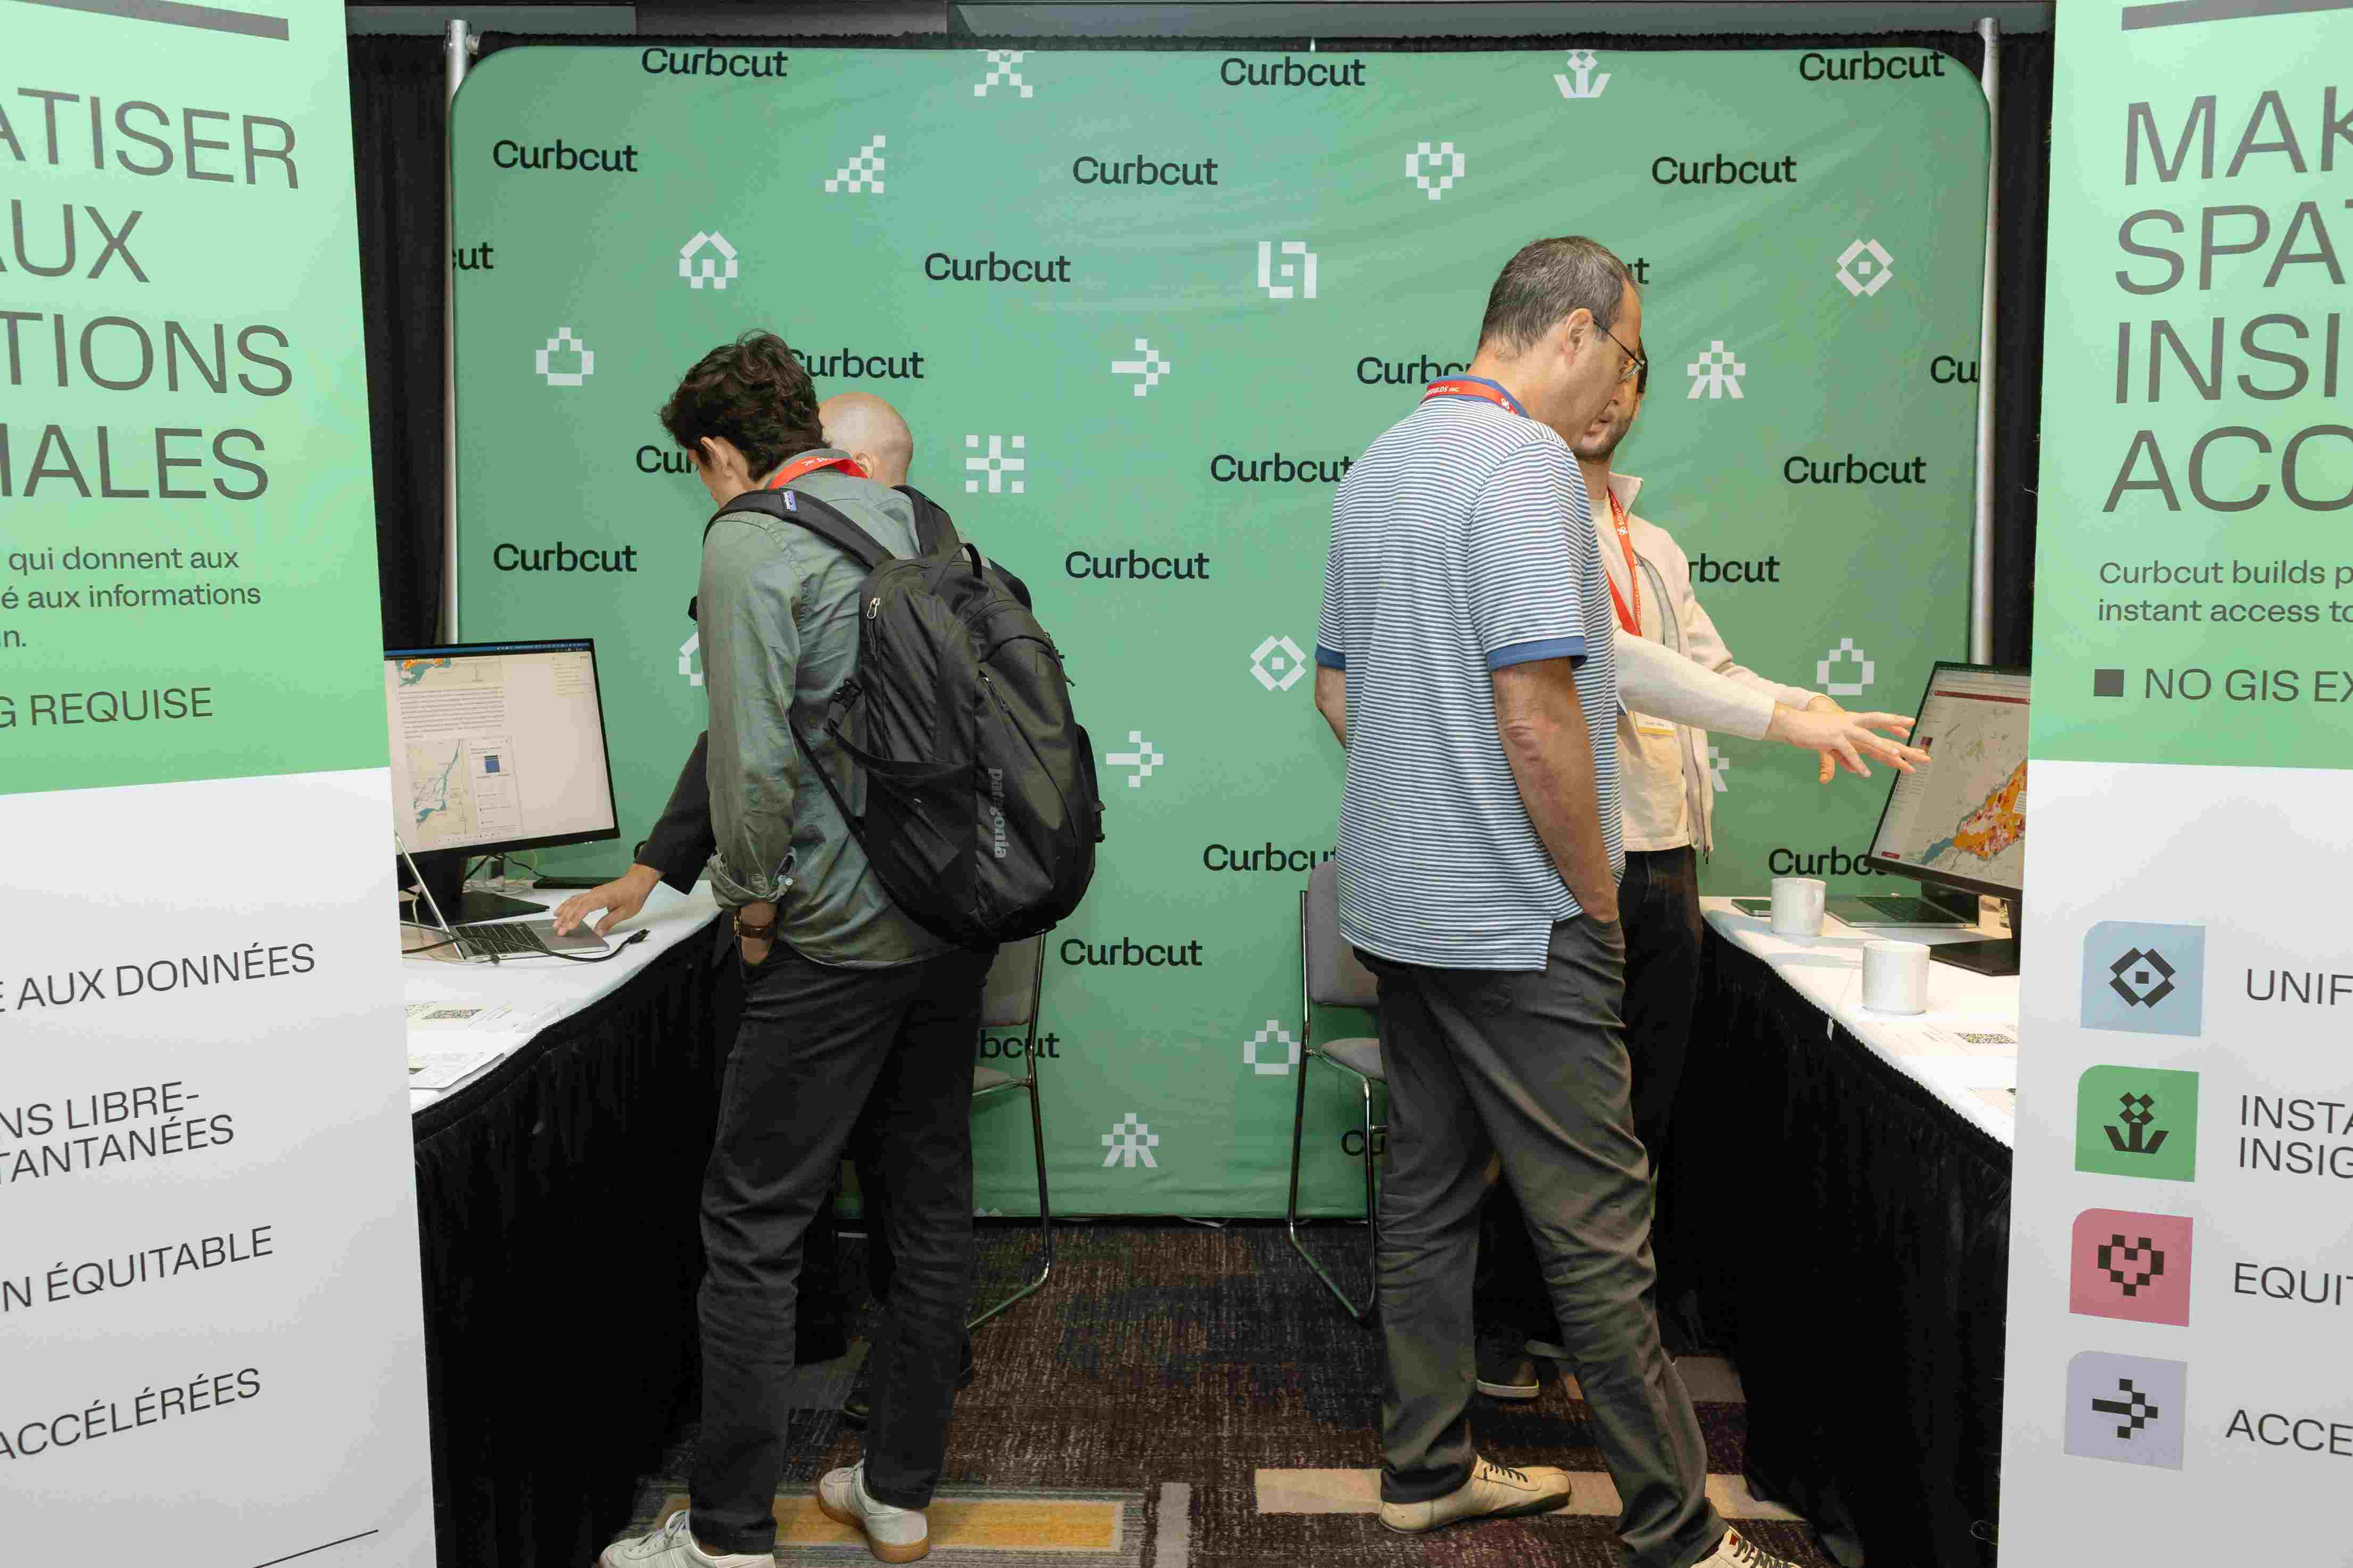
- See you at SIIViM 2026! From October 13-15, we’ll be in Mont-Tremblant for the Sommet International de l’InnovationMunicipale. More than 600 municipal leaders and innovators from over 100 municipalities will be there. On Thursday, October 15, Sam will join Catherine Gagné from the City of Laval on stage to show how Curbcut Laval brings together data from across the region into a single social development observatory. Catch it during the Valorisation de données session (1-2p.m., Chalet des congrès). If you’re attending, come say hi!