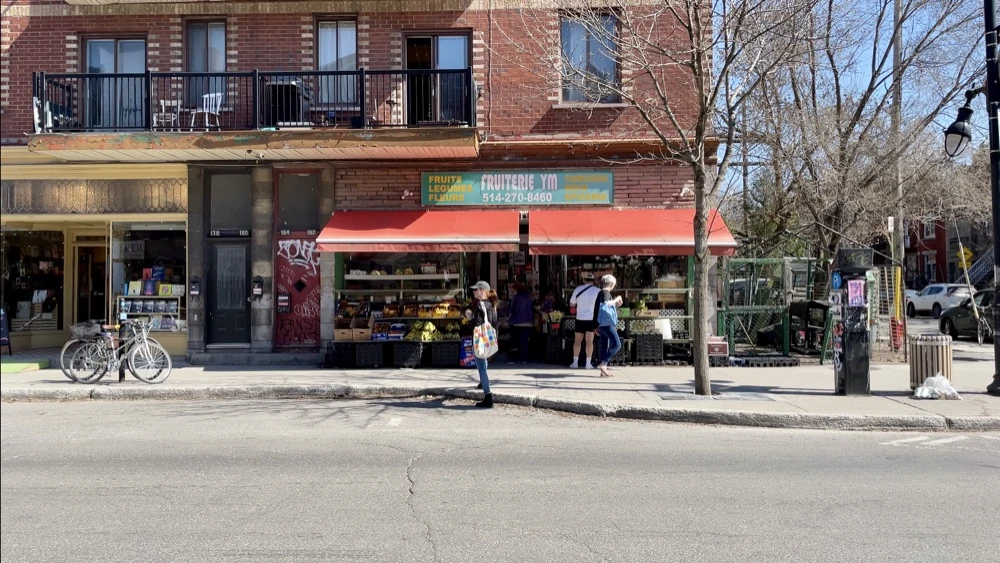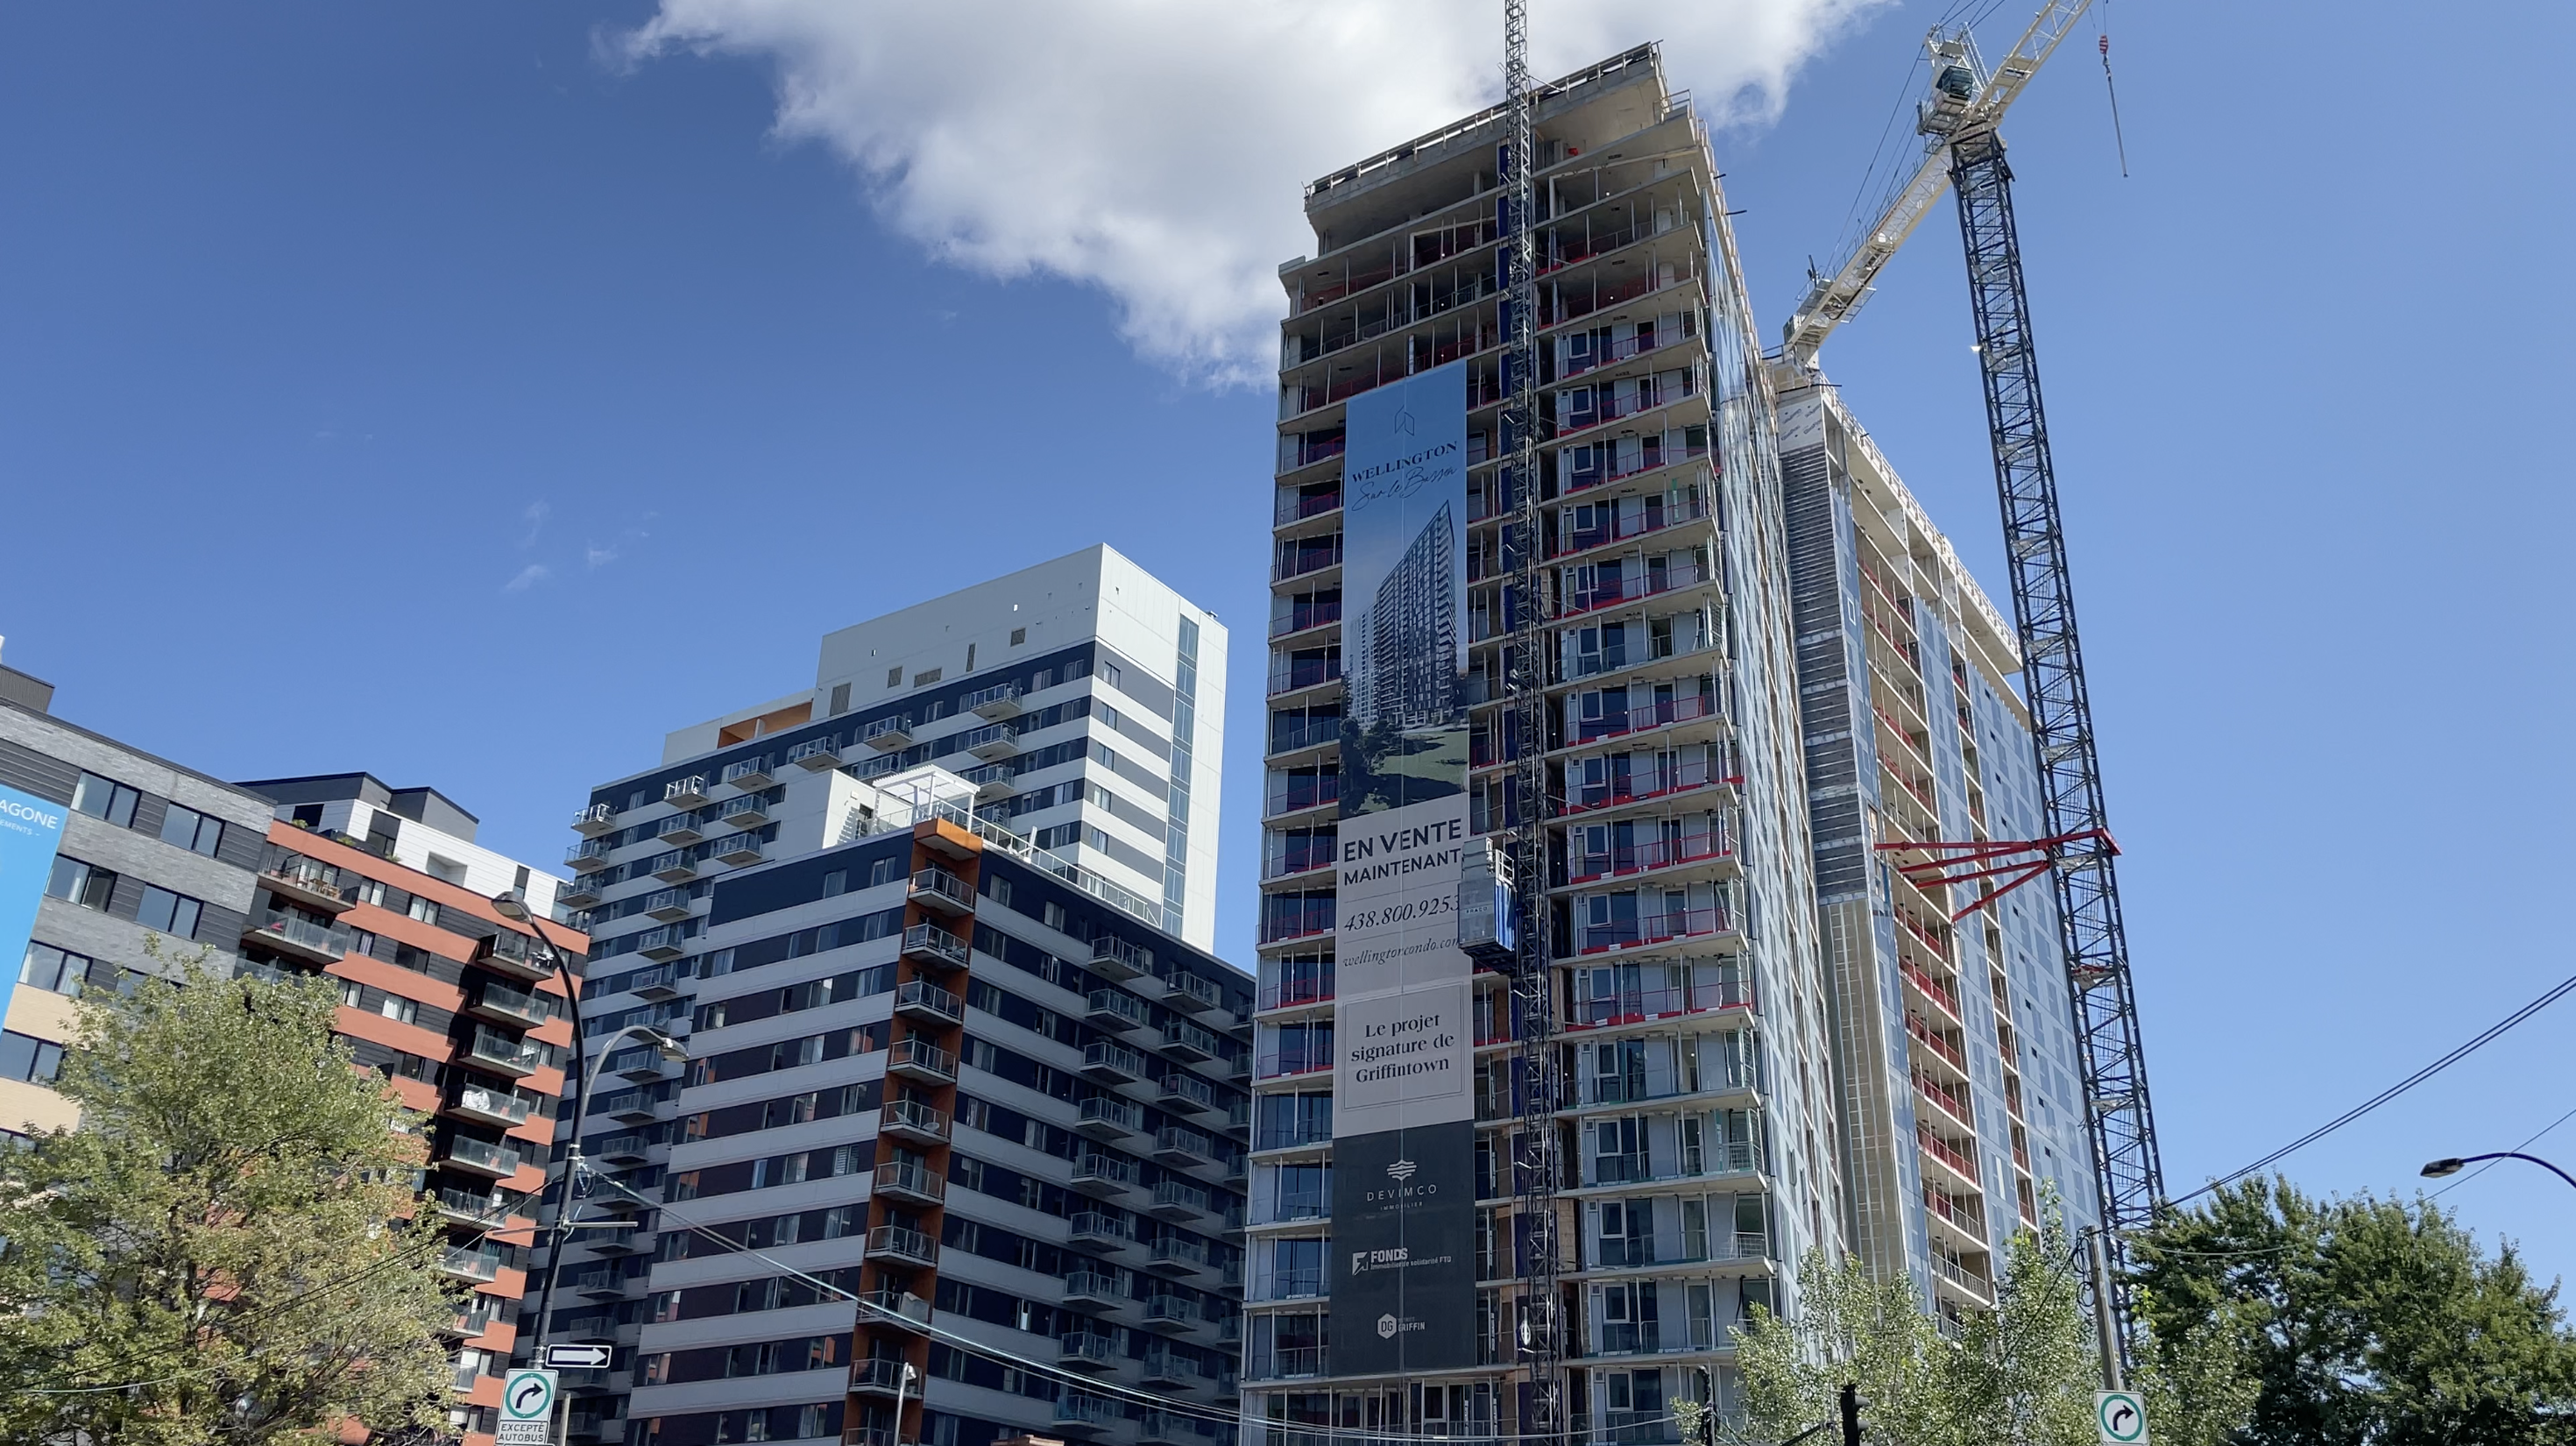
Canada is home to more than 40 million people today — nearly double its population three decades ago. That growth has shown up on the ground as single-family homes in the suburbs, four-storey apartments in urban neighbourhoods, and high-rise condos in city centres. But when urban planners want to evaluate zoning plans and housing policy, or researchers want to compare urban sprawl across cities, they run into the same wall: there's no consistent, historical land-use or housing inventory that supports multi-city comparison in Canada. Census data captures dwelling counts, but only at a spatially aggregated level — not fine enough to show exactly where and when different types of housing appeared.
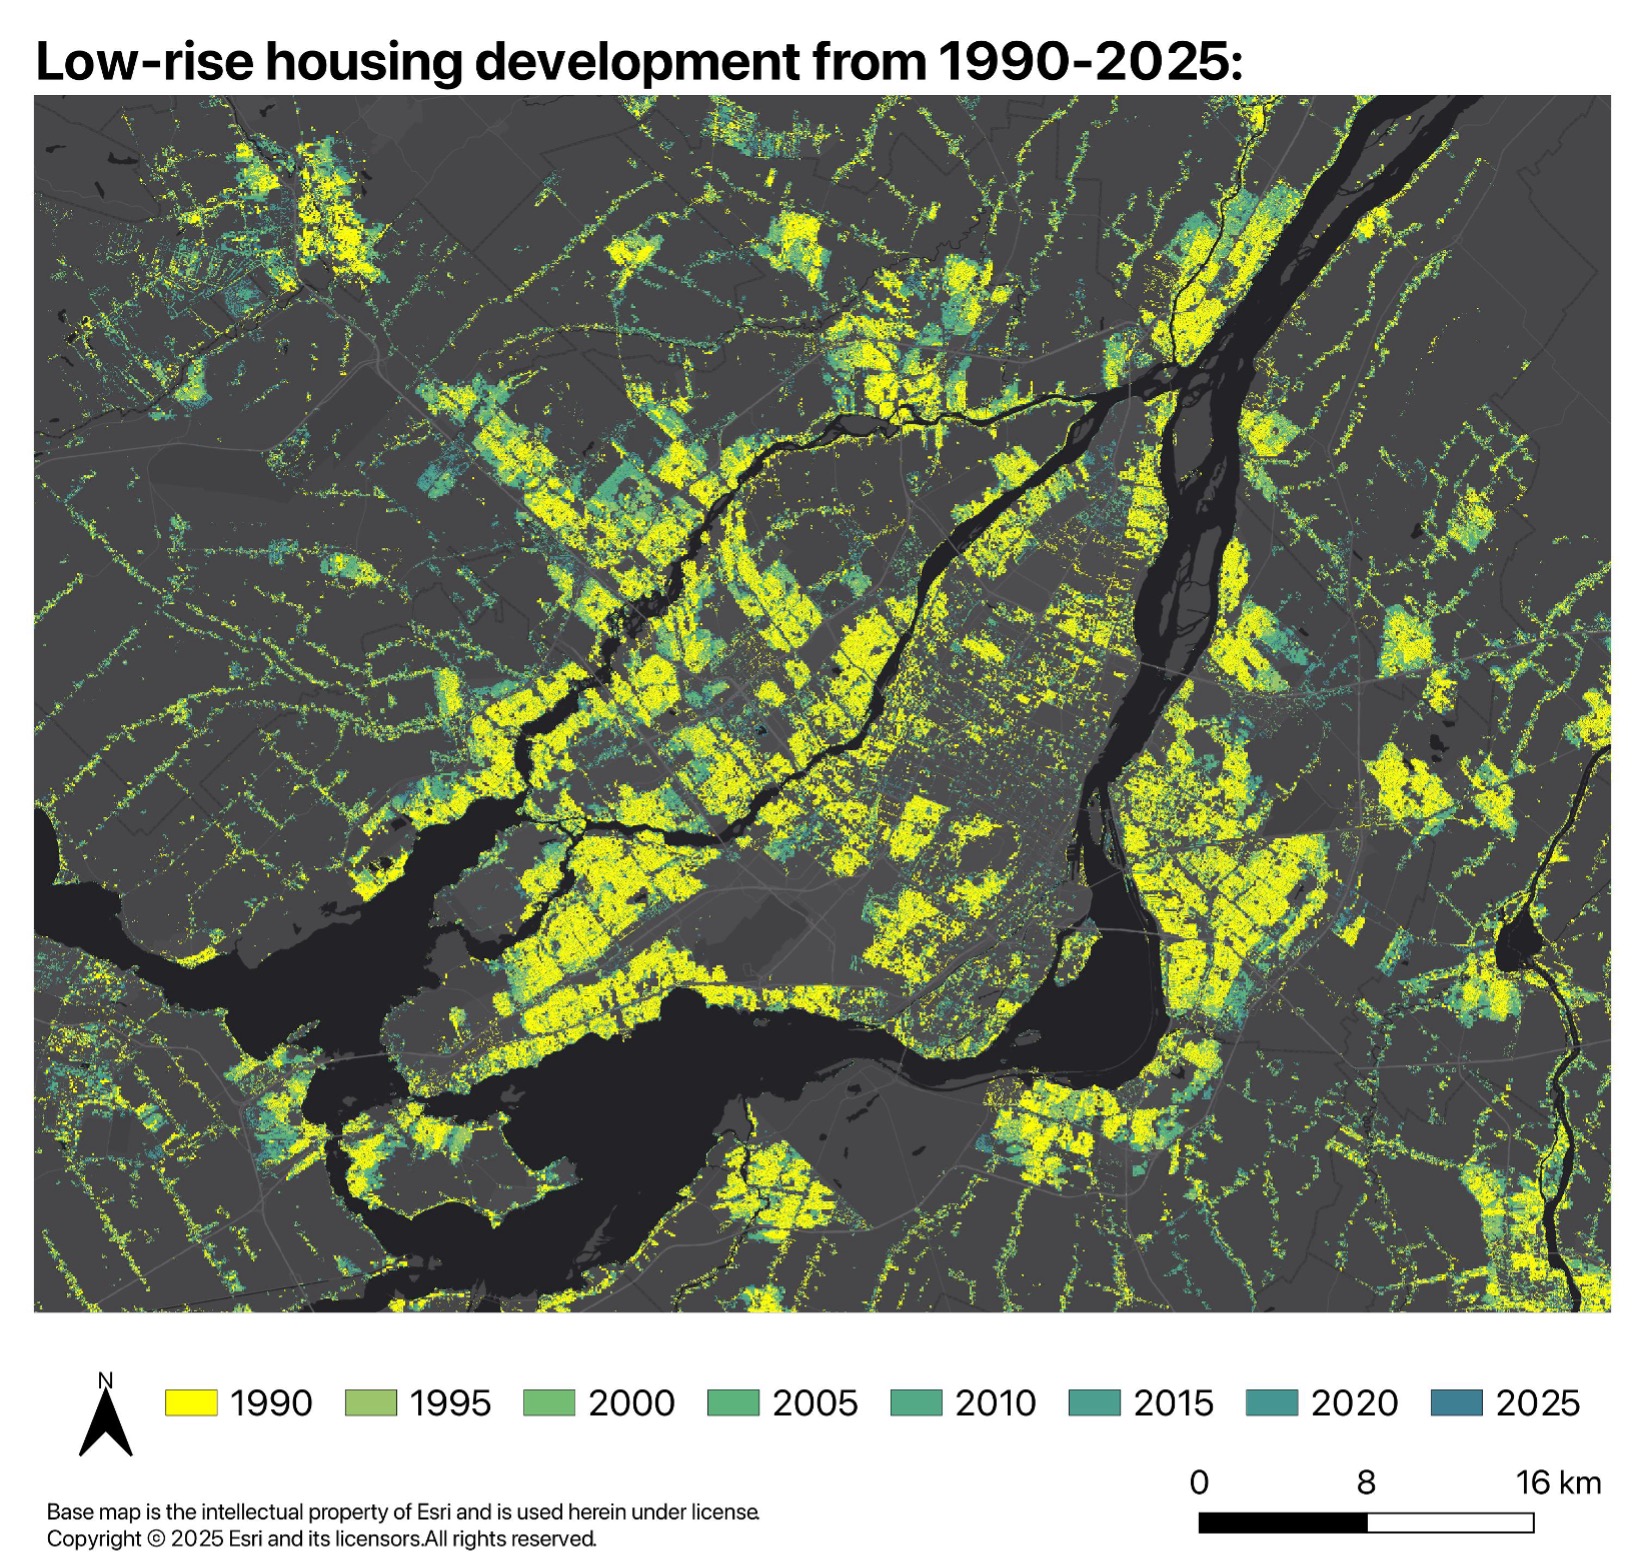
At Curbcut, we set out to close that gap. We mapped 35 years of housing development and land cover change, from 1990 to 2025, across 11 major Canadian metropolitan areas. By combining historical satellite imagery, global human settlement data, and census statistics, we classified housing types and land cover at the pixel level, giving a far more granular picture of how Canadian cities have grown.
Building a consistent record from satellite imagery
Mapping change over 35 years first requires a consistent, harmonized source of historical imagery. We used two complementary satellite products suited to our spatial and temporal scale:
- Landsat 5, operating from 1984 to 2013 with a 16-day revisit cycle, gave us land cover information from 1990 to 2010.
- Harmonized Landsat Sentinel-2 (HLS), a NASA program launched in 2016 that combines Landsat 8, Landsat 9, and Sentinel-2A/B/C, gave us improved coverage from 2015 onward.
For each five-year interval from 1990 to 2025, we generated cloud-free median composite images using imagery from April to October,when vegetation is most visible and cloud cover is typically below 50%. Each composite represents a snapshot of land conditions at that point in time.
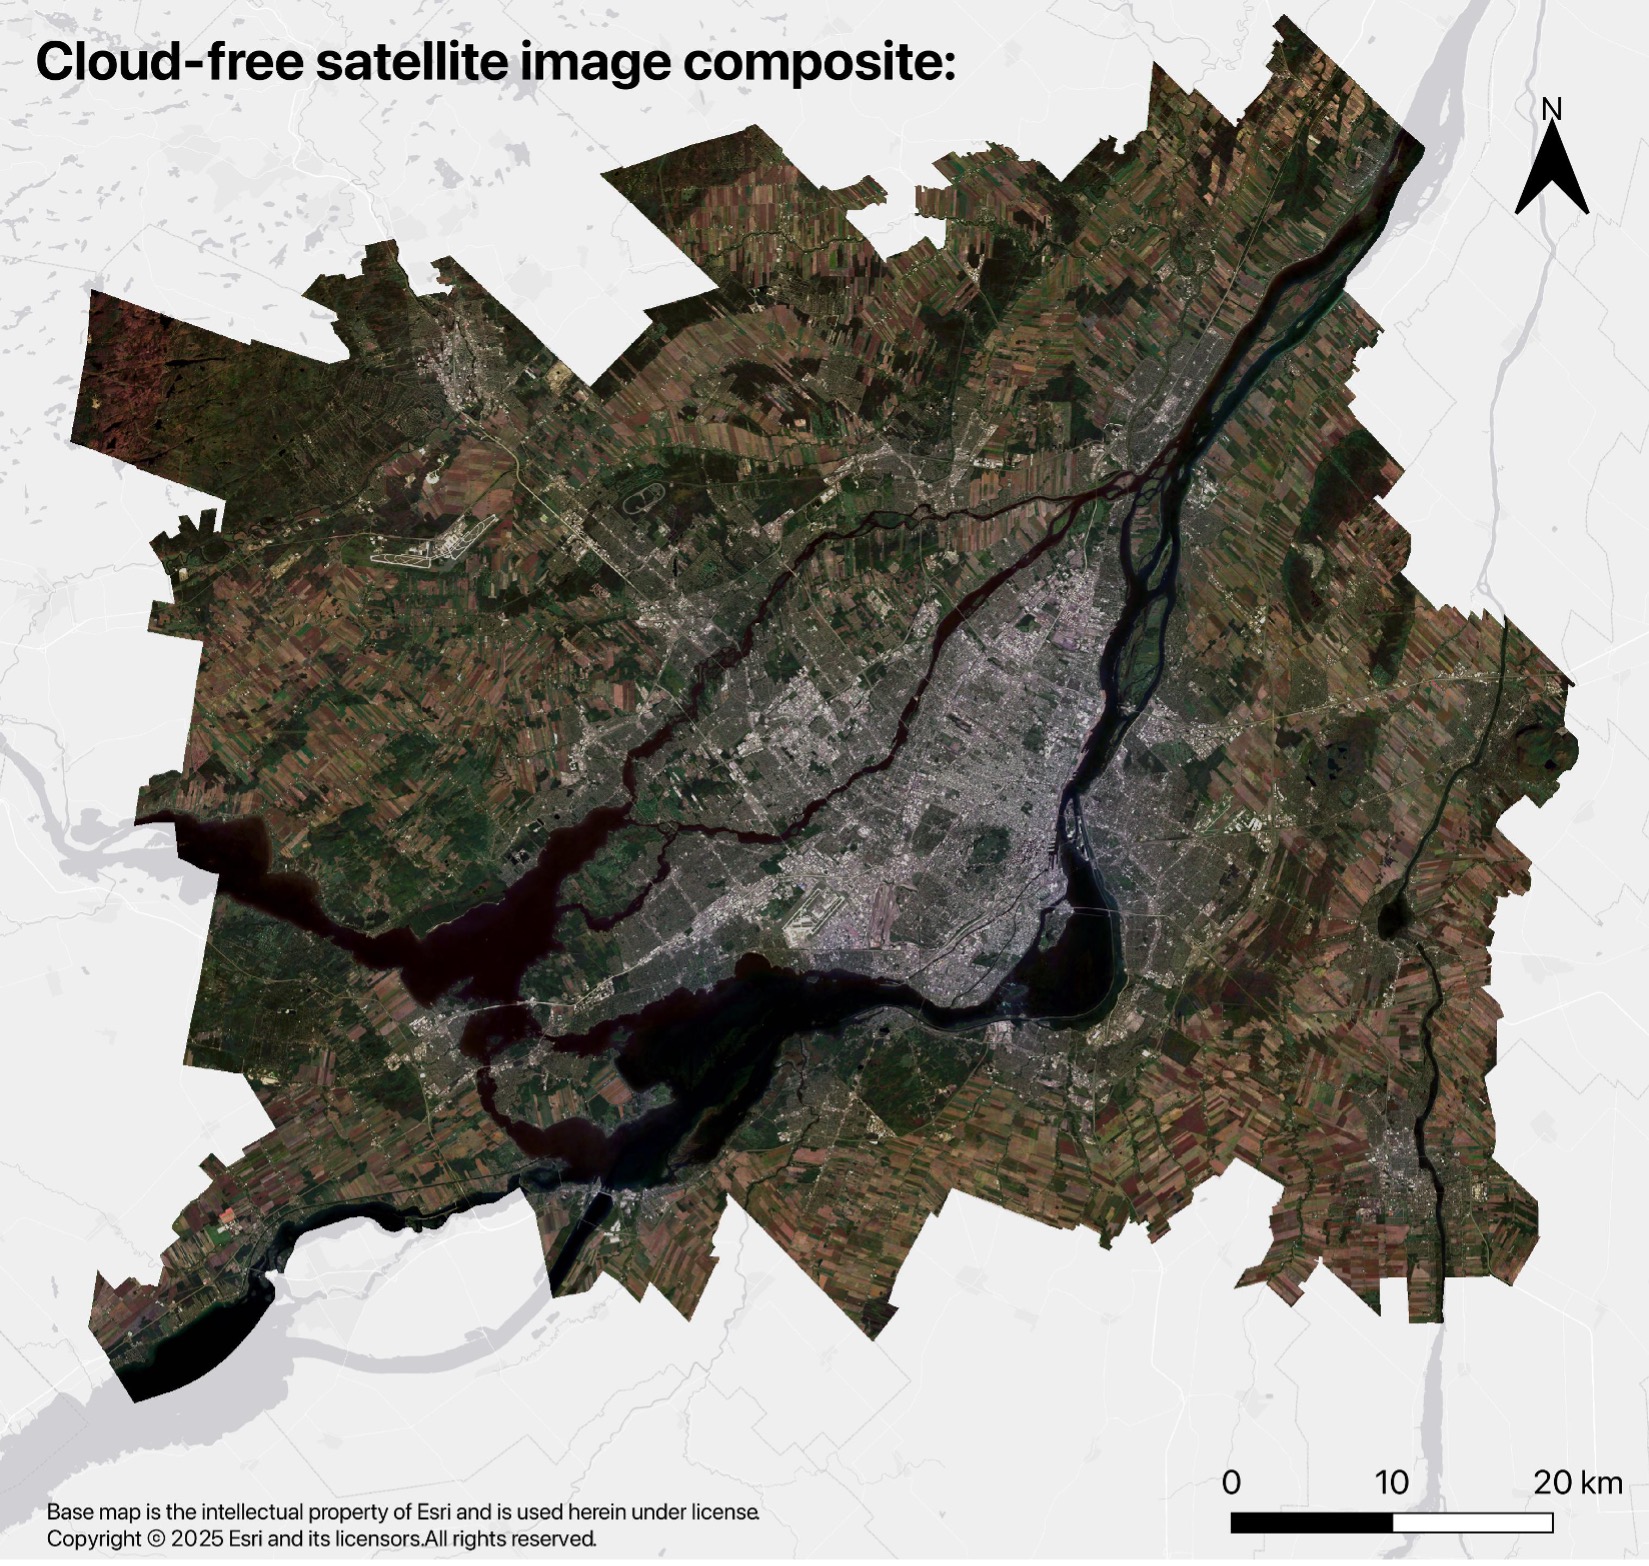 Satellite composite imagery used for classification
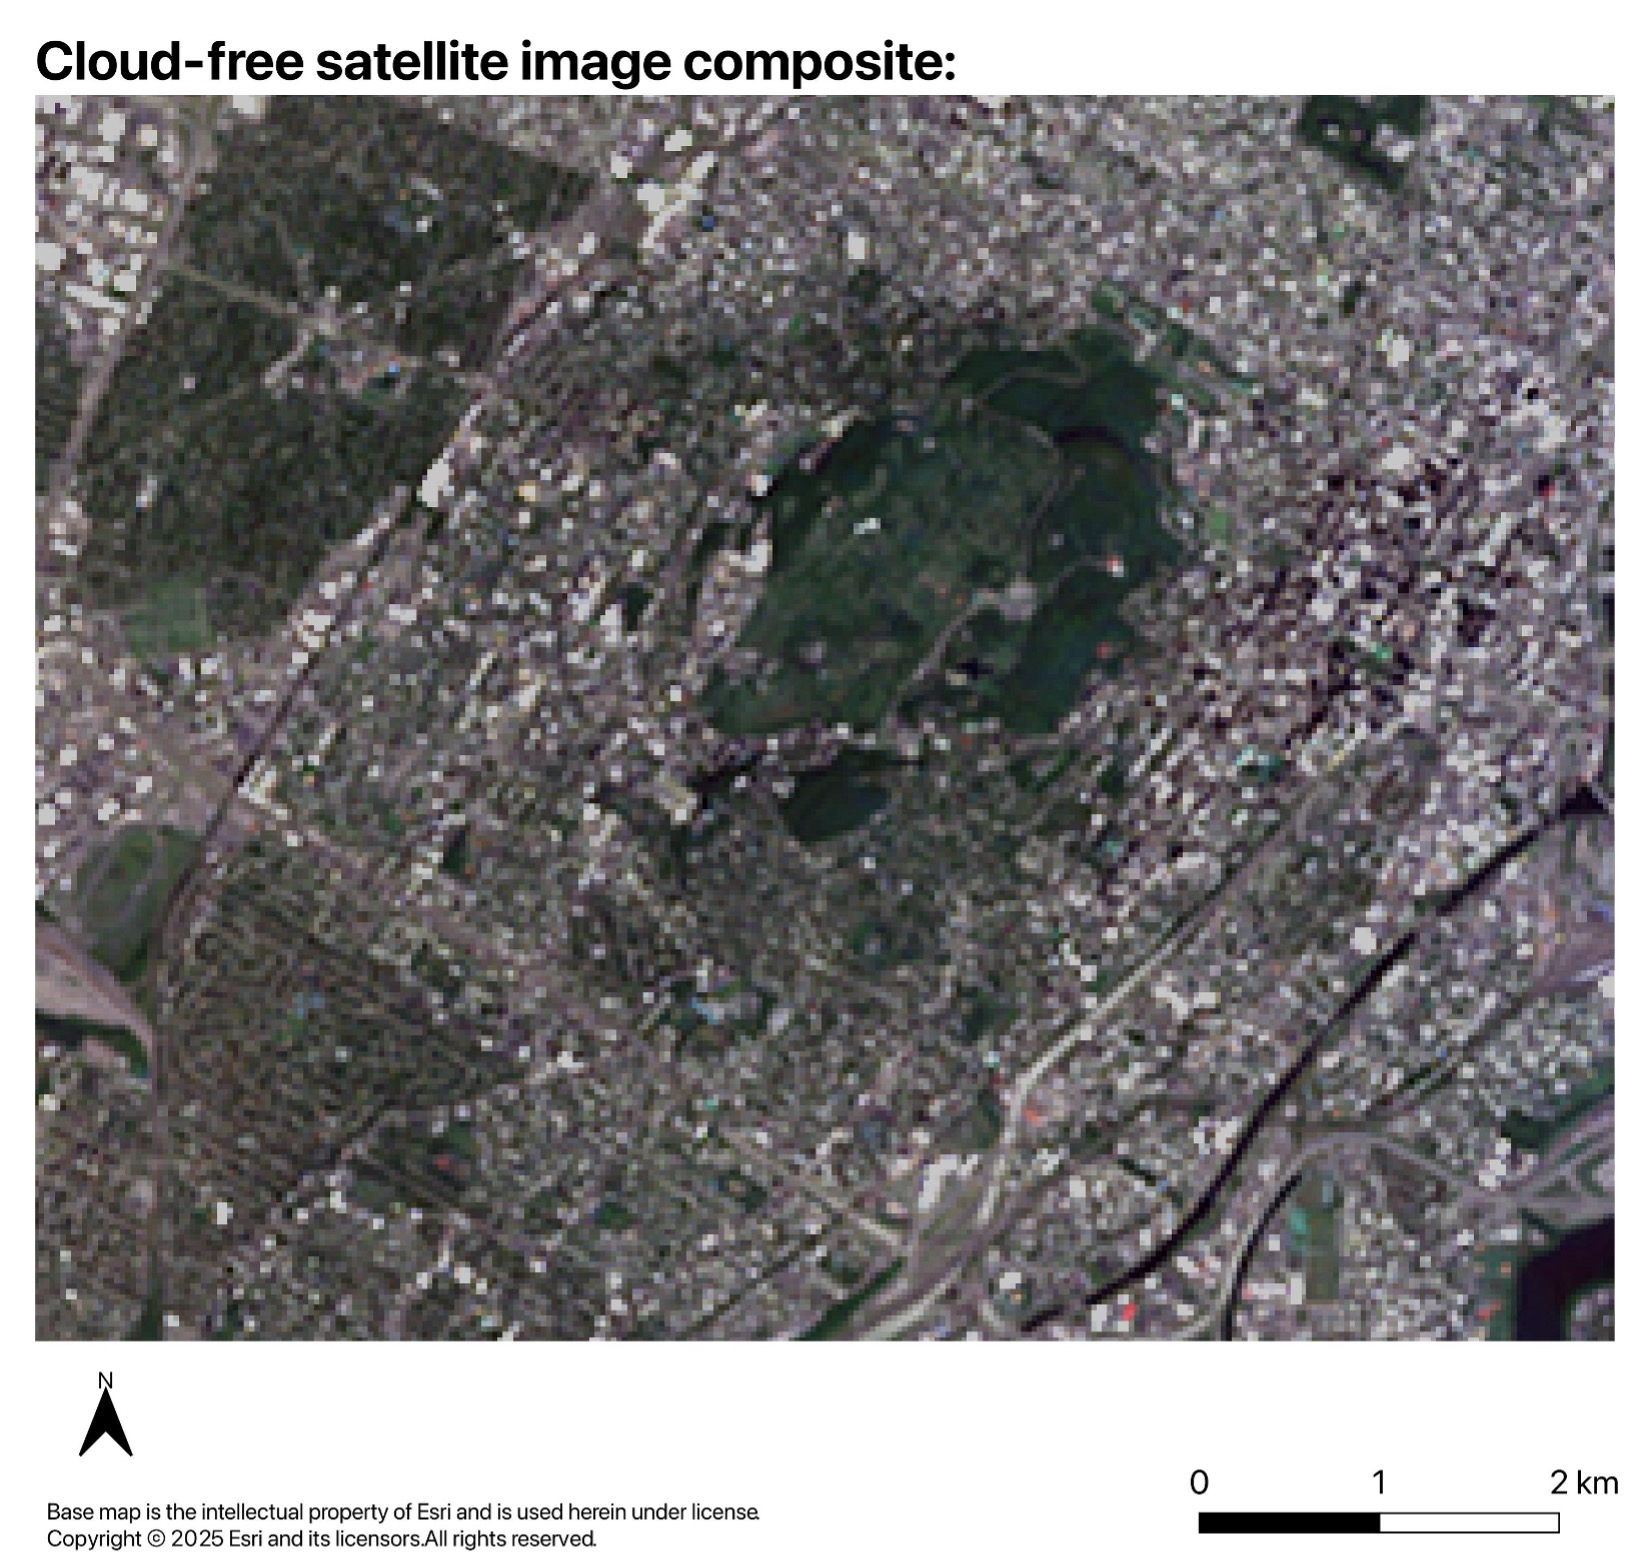 Zoomed-in view of satellite imagery detail
Classifying land cover in two steps
We used a two-step classification approach: first separating broad land cover types, then refining the classification into specific housing types.
In the first step, we calculated several spectral indices from the processed imagery — the Normalized Difference Vegetation Index (NDVI), Normalized Difference Built-up Index (NDBI), Normalized Difference Water Index (NDWI), and land surface albedo — to distinguish vegetation, built-up surfaces, water, and bright impervious surfaces respectively. We combined these indices with the imagery's Red-Green-Blue bands and manually selected training samples (water, vegetation, low-rise housing, and other built-up areas) to run a supervised Random Forest classification for each city. This gave us the foundation for the more detailed housing classification that followed.
Grounding the classification in housing and demographic data
Classifying specific housing types requires more than satellite data alone — it requires ground-truth information about how people actually live in a given area. We used Statistics Canada's Census of Population, extracting dwelling counts by structural type for each dissemination area, and grouped them into three categories that satellite imagery can reasonably distinguish:
- Low-rise residential: single detached houses, semi-detached houses, row houses, duplexes, and mobile homes.
- Mid-rise residential: apartment buildings under five storeys, which read as larger, more compact structures.
- High-rise residential: apartment buildings of five storeys or more.
 Example of low-rise residential housing
Disaggregating population with GHSL
To bridge the gap between pixel-level imagery and neighbourhood-level census data, we brought in the Global Human Settlement Layer (GHSL), produced by the European Commission. GHSL estimates residential population and non-residential built-up area at a 100-metre grid resolution, updated every five years, drawing on satellite imagery, census data, and geographic databases. This gave us a much finer-grained reference layer to work with alongside the aggregated census counts.
Learning the population signature of each housing type
Different housing types carry distinct population densities — low-rise areas typically hold the fewest people, followed by mid-rise, then high-rise. To quantify this, we identified census neighbourhoods containing only a single housing type, overlaid them with GHSL population data, and sampled the corresponding pixels. From these samples we calculated the average population and the upper and lower quartiles for each housing type.
The result: a set of expected population ranges, by housing type, that we could apply anywhere in the country — including in mixed-housing neighbourhoods where the census alone couldn't tell us which pixel was which.
Bringing it together: classifying housing types
With land cover classifications, census data, and GHSL population and built-up estimates in hand, we applied a set of logical decision rules to refine the final classification.
For example, if a pixel was initially classified as built-up or low-rise housing, but GHSL and census data showed no residential population — or a strong non-residential signal — we reclassified it as non-residential built-up area.
We treated single- and mixed-housing neighbourhoods differently, based on the census:
- In single-housing-type neighbourhoods, built-up or low-rise pixels that also showed residential population and residential built-up area in GHSL were reassigned to that neighbourhood's housing type.
- In mixed-housing neighbourhoods, we used the population ranges derived earlier to sort pixels: a pixel falling within the mid-rise population range was classified as mid-rise; one exceeding both the low-rise and mid-rise ranges was classified as high-rise.
Finally, we layered in road network data for each time period, rasterized to match the rest of the classification. The result is a final map with seven classes: Water, Vegetation, Low-rise Residential, Mid-rise Residential, High-rise Residential, Non-Residential Built, and Road.
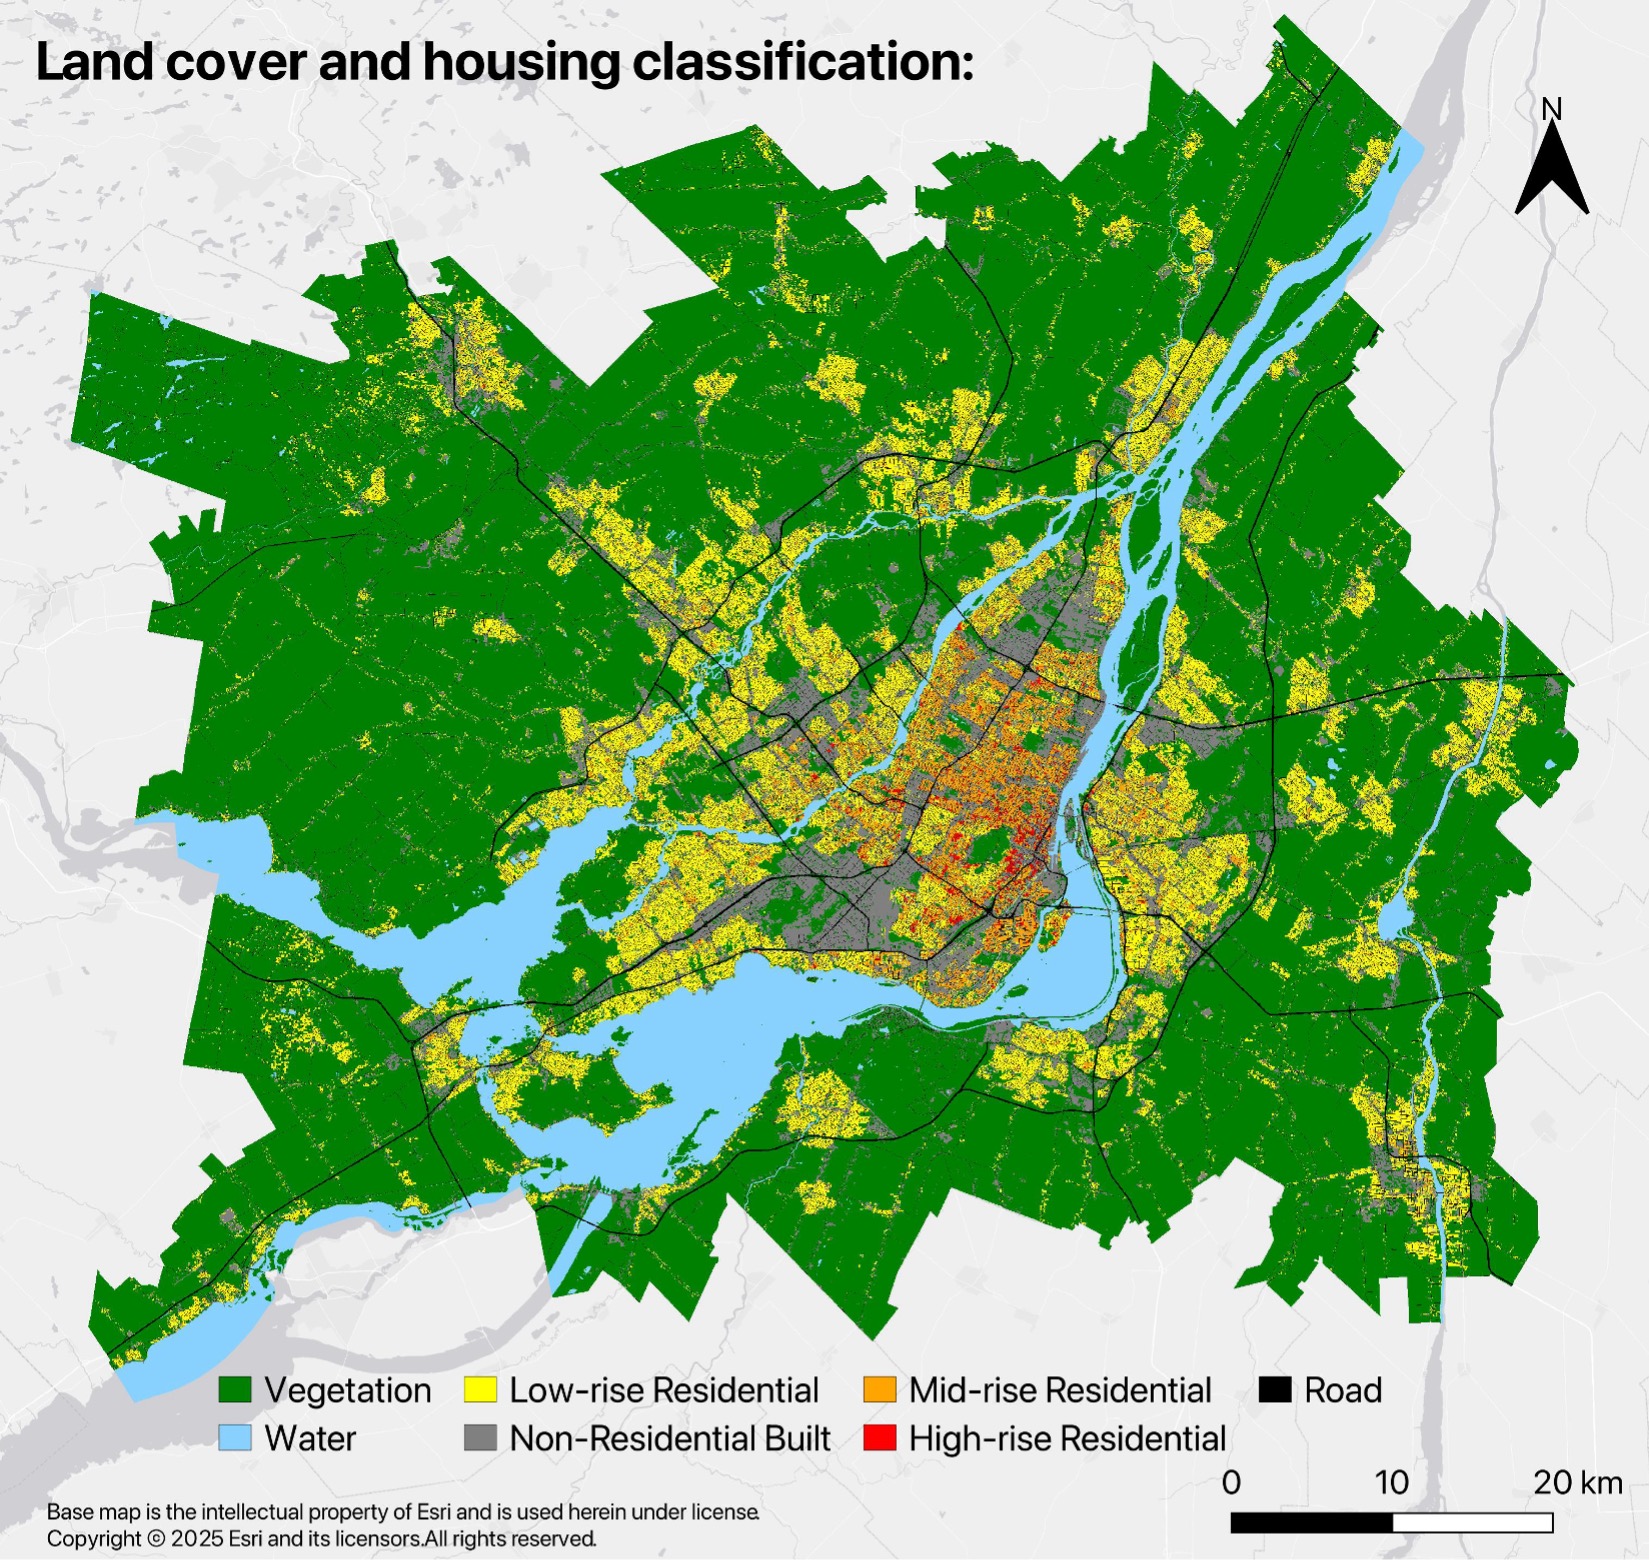 Land use classification map
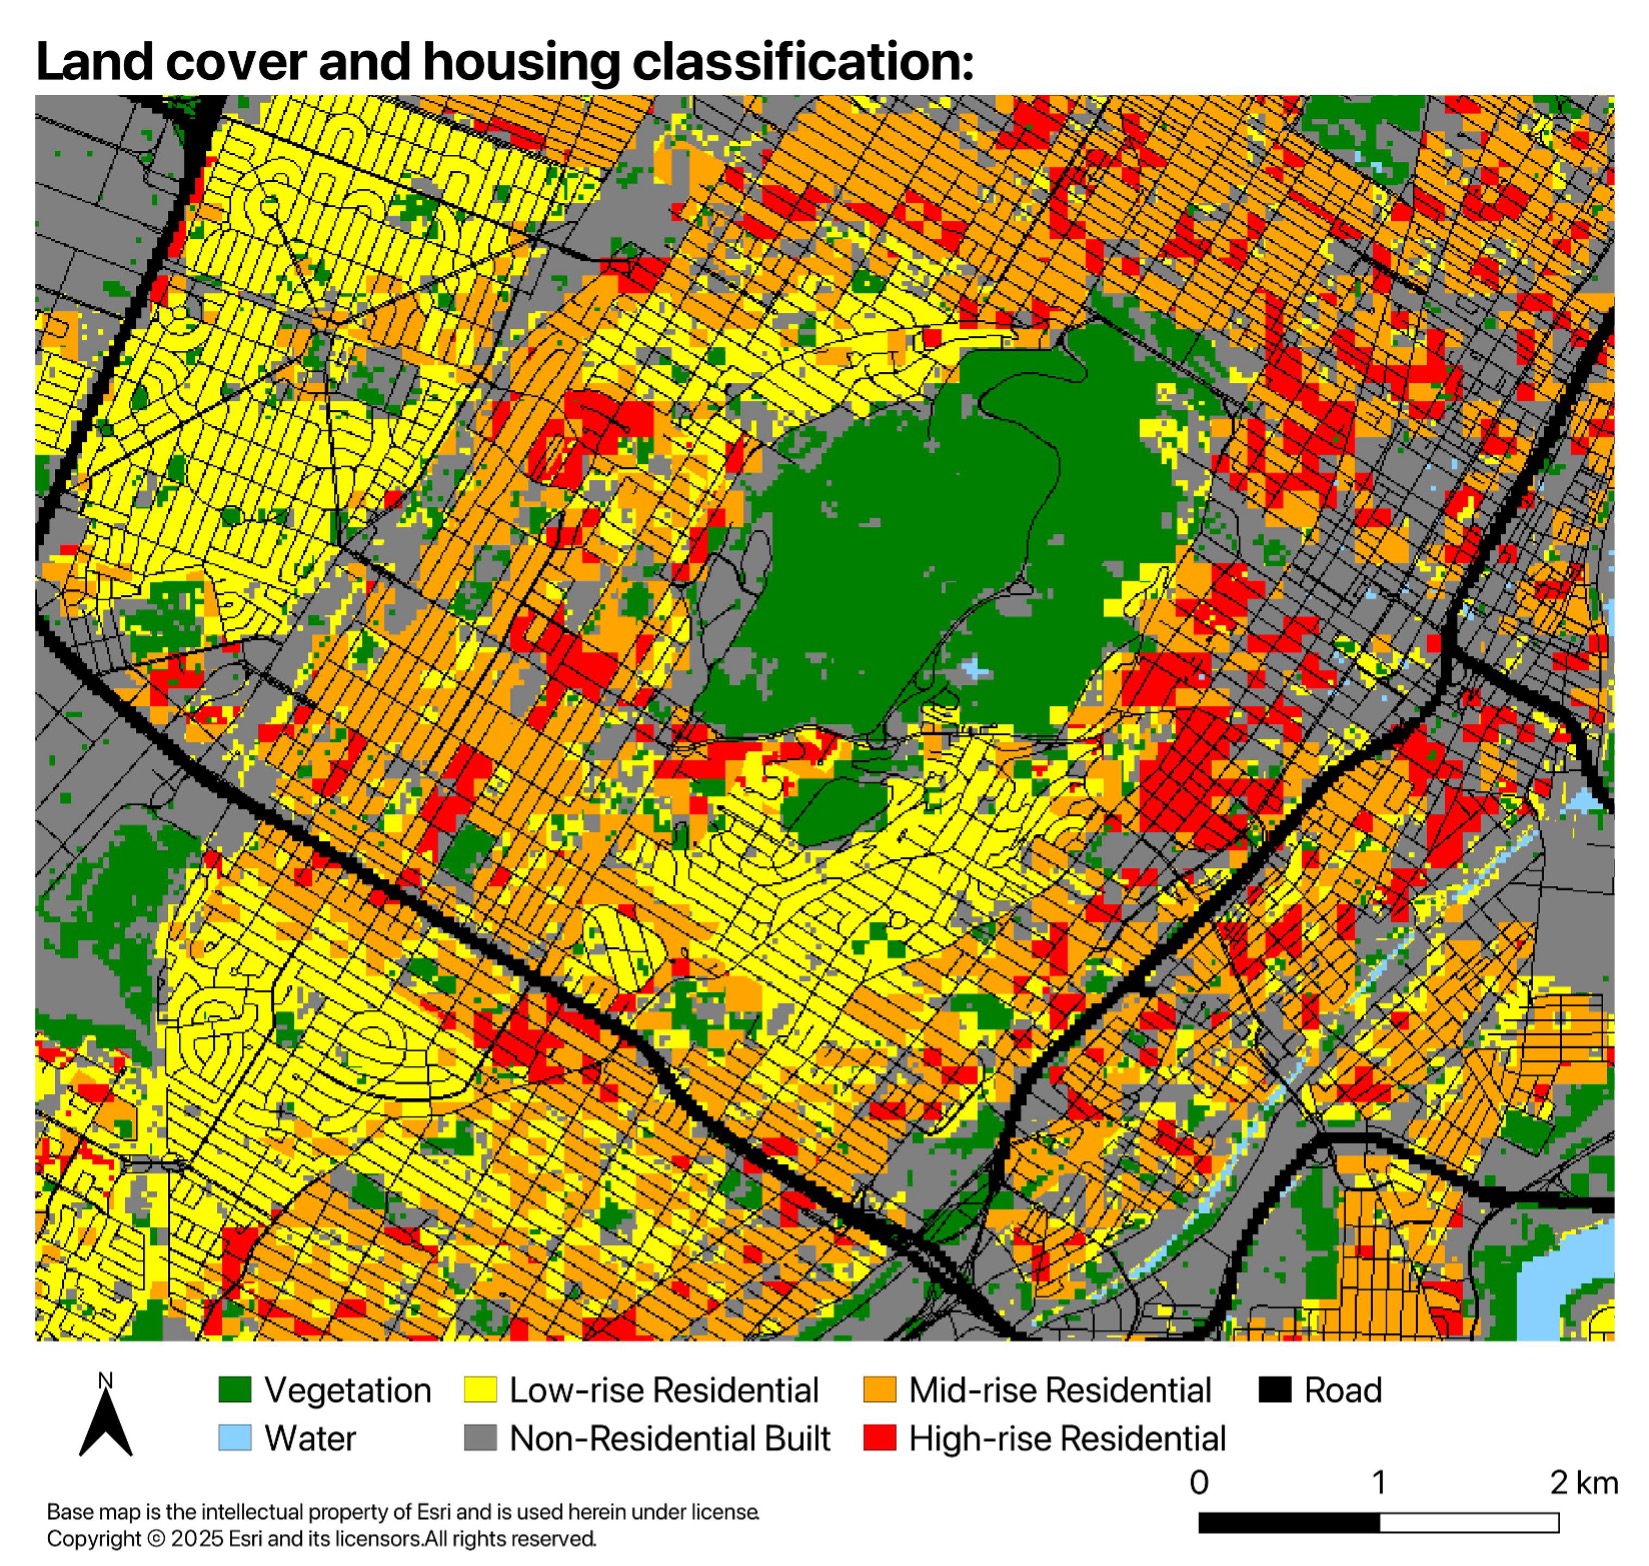 Zoomed-in detail of land use classification
What this data makes possible
This dataset opens up questions that simply weren't answerable at this resolution before: How has housing development expanded over the decades? Where and when did greenfield development occur? How do housing types differ across Canadian cities, and how have those differences evolved?
Beyond the pixel-level detail, our classification gives planners and researchers a way to move past aggregated census snapshots and track housing development trends across cities, over time, and at scale. It's a tool for monitoring the real-world effects of housing policy, and for informing what comes next in Canadian urban growth.

Making Transport Poverty Visible: Curbcut's Dashboard for Mobilizing Justice
Read more →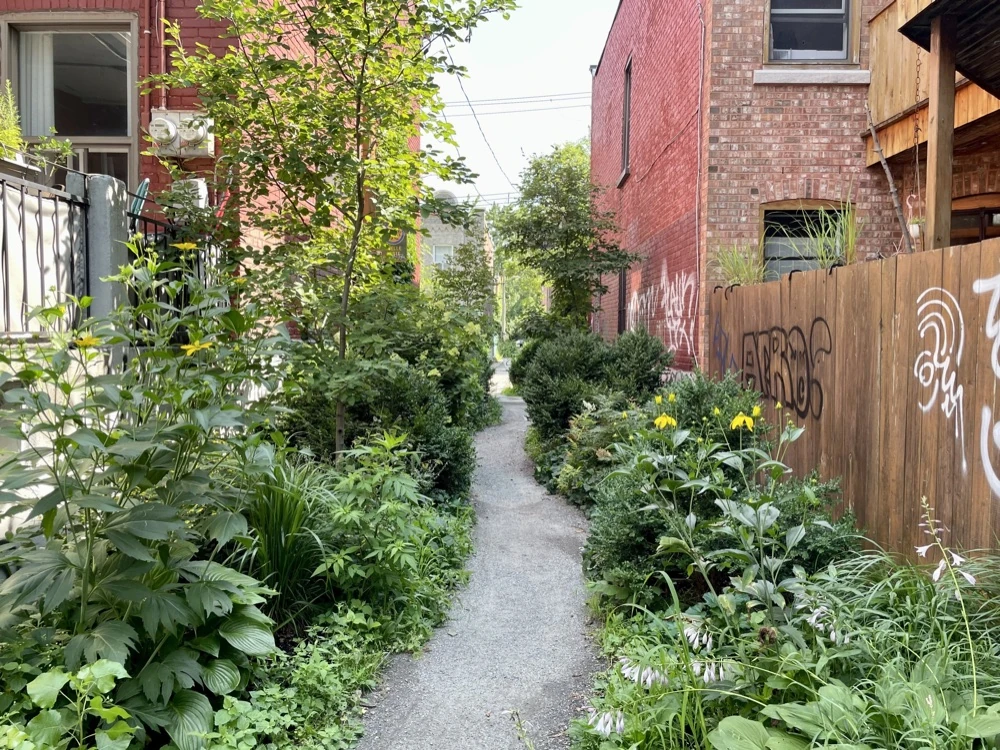
Why Walkable Neighborhoods Matter for Health, Community, and Everyday Life
Read more →